EM Emissions
EMA has extensive experience in electromagnetic emissions (EM emissions) from a wide variety of sources, including cables and individual electronic components such as in aircraft avionics or wireless communications.
One example of this work is in our calculation of the far-field EM emissions generated by internal electronics units in a wireless communications station. In our calculation, we took near-field EM measurements of each individual unit and used our state-of-the-art EMA3D software to generate the far-field emissions results. The near-field measurements were performed with simple table-top equipment and are relatively inexpensive to obtain.
EMA3D has a powerful platform on which far-field EM emission predictions can be obtained from near-field measurements using an equivalent Huygens surface. Using this platform, a variety of emission scenarios can be simulated in an efficient, low cost way.
We show example results from our far-field EM emissions simulation in Figures 1 and 2.
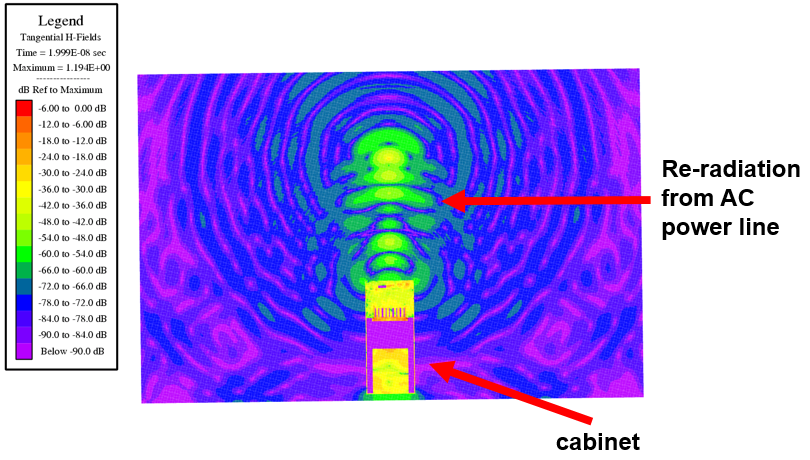
Figure 1: The magnitude of magnetic field components tangential to the image being emitted by the units within the wireless communication station during simulation. The role of the power line as a parasitic antenna is seen.
Figure 1 shows the generated magnetic field on a plane that cuts through the wireless communication station, or ‘cabinet’. The unit emitters are inside of the cabinet and emit fields which propagate outside of the cabinet, as seen in the Figure.
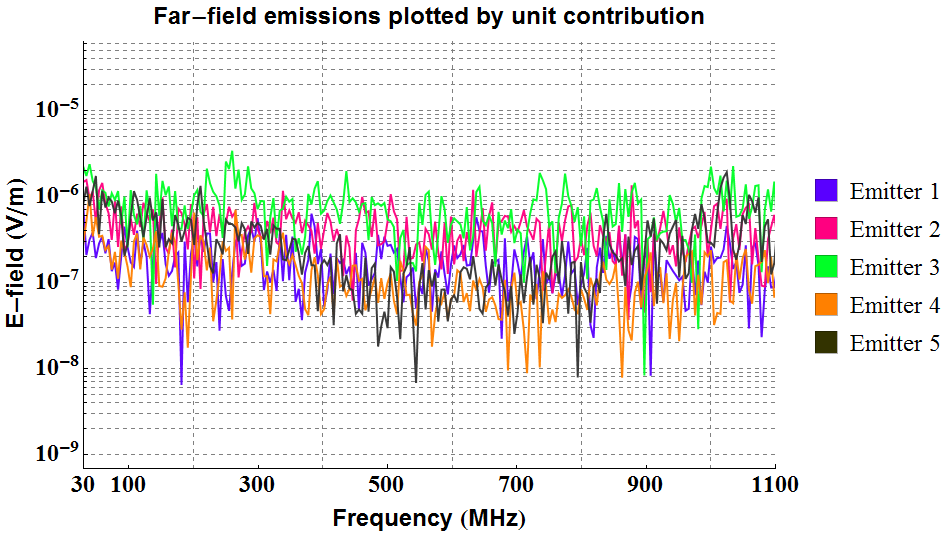
Figure 2: EMA3D simulation results of the far-field EM emissions generated by the wireless communication station. Simulation allows for identification of each unit’s contribution to the emissions.
Figure 2 shows far-field emissions identified and plotted by individual contribution from each of the five unit emitters in the frequency domain. The total far-field emissions are the sum of the contribution from the individual emitters. EMA’s powerful software suite allows for a variety of plotting and simulation scenarios.